3. Trigonometry
c. Circle Definitions
4. Plots of Trig Functions
We would like to find the plots of the six trig functions.
Sine and Cosine Plots
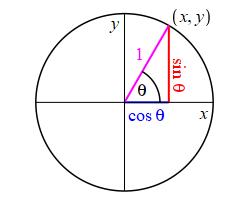
This plot shows a unit circle, (i.e. \(r=1\)) with a radial line at an
angle \(\theta\) counterclockwise from the positive \(x\)-axis. The
radial line intersects the circle at a point:
\[
P=(x,y)=(\cos\theta,\sin\theta)
\]
So to plot \(\sin\theta\), we need to plot \(y\) as \(\theta\) changes.
And to plot \(\cos\theta\), we need to plot \(x\) as \(\theta\) changes.

This is done in the animation.
As \(\theta\) increases, \(y\) goes up and down which is graphed at
the right and \(x\) goes left and right which is graphed below.
(Tilt your head to the right for cosine.)

Tangent and Cotangent Plots
We would like to have a similar construction for \(\tan\theta\) and \(\cot\theta\).
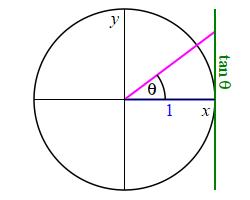
The first plot shows a unit circle, (i.e. \(r=1\)) with a radial line at an angle \(\theta\) counterclockwise from the positive \(x\)-axis and a vertical tangent line at the right side. These intersect to form a right triangle. Since \(\tan\theta=\dfrac{\text{Opp}}{\text{Adj}}\), and the adjacent side is the radius which is \(1\), i.e. \(\text{Adj}=r=1\), the opposite side must be \(\tan\theta\), i.e. \(\text{Opp}=\tan\theta\), as shown in the figure.

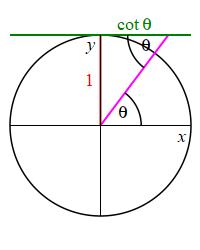
The second plot shows the same unit circle but with a horizontal tangent line at the top. These again intersect to form a right triangle but with the angle \(\theta\) at the top-right. Since \(\cot\theta=\dfrac{\text{Adj}}{\text{Opp}}\), and this time the opposite side is the radius which is \(1\), i.e. \(\text{Opp}=r=1\), the adjacent side must be \(\cot\theta\), i.e. \(\text{Adj}=\cot\theta\), as shown in the figure.

So to plot \(\tan\theta\), we plot where the radial line intersects
the vertical tangent line.
And to plot \(\cot\theta\), we plot where the radial line intersects
the horizontal tangent line.
This is done in the animation.
(Tilt your head to the right for cotangent.)

Secant and Cosecant Plots
We would like to have a similar construction for \(\sec\theta\) and \(\csc\theta\).
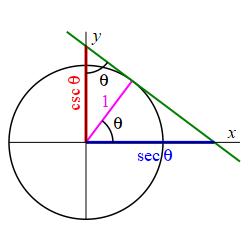
The plot shows a unit circle, (i.e. \(r=1\)) with a radial line at an angle \(\theta\) counterclockwise from the positive \(x\)-axis together with the tangent line at the point where the radial line hits the circle. The radial line, the tangent line and the axes form two triangles.
For the triangle below the radial line, the adjacent side is the radius which is \(1\), i.e. \(\text{Adj}=r=1\). Since \(\sec\theta=\dfrac{\text{Hyp}}{\text{Adj}}\), the hypotenuse must be \(\sec\theta\), i.e. \(\text{Hyp}=\sec\theta\), as shown in the figure.
For the triangle above the radial line, the angle \(\theta\) is now at the top and the opposite side is the radius which is \(1\), i.e. \(\text{Opp}=r=1\). Since \(\csc\theta=\dfrac{\text{Hyp}}{\text{Opp}}\), the hypotenuse must now be \(\csc\theta\), i.e. \(\text{Hyp}=\csc\theta\), as shown in the figure.

So to plot \(\sec\theta\) and \(\csc\theta\), we construct the tangent
line at the point where the radial line hits the circle.
To plot \(\sec\theta\), we plot where this tangent line intersects the
\(x\)-axis.
And to plot \(\csc\theta\), we plot where this tangent line intersects the
\(y\)-axis.
This is done in the animation.
(Tilt your head to the right for secant.)

Heading
Placeholder text: Lorem ipsum Lorem ipsum Lorem ipsum Lorem ipsum Lorem ipsum Lorem ipsum Lorem ipsum Lorem ipsum Lorem ipsum Lorem ipsum Lorem ipsum Lorem ipsum Lorem ipsum Lorem ipsum Lorem ipsum Lorem ipsum Lorem ipsum Lorem ipsum Lorem ipsum Lorem ipsum Lorem ipsum Lorem ipsum Lorem ipsum Lorem ipsum Lorem ipsum